On any given day, Dub Analytics tracks upwards of 200,000 click events, which translates to roughly 7 million events per month (growing at a 30% month-over-month rate).
With the sheer volume of data that's tracked, it is important to be able to easily filter and create reports to help marketing teams make informed decisions.
This is why we're excited to announce Dub Analytics 2.0, which comes with a host of new features and improvements:
- New Filter UX – Keyboard-friendly filter dropdown with multiple filter facets
- "Ask AI" feature – Use natural language to analyze your data & create personalized reports
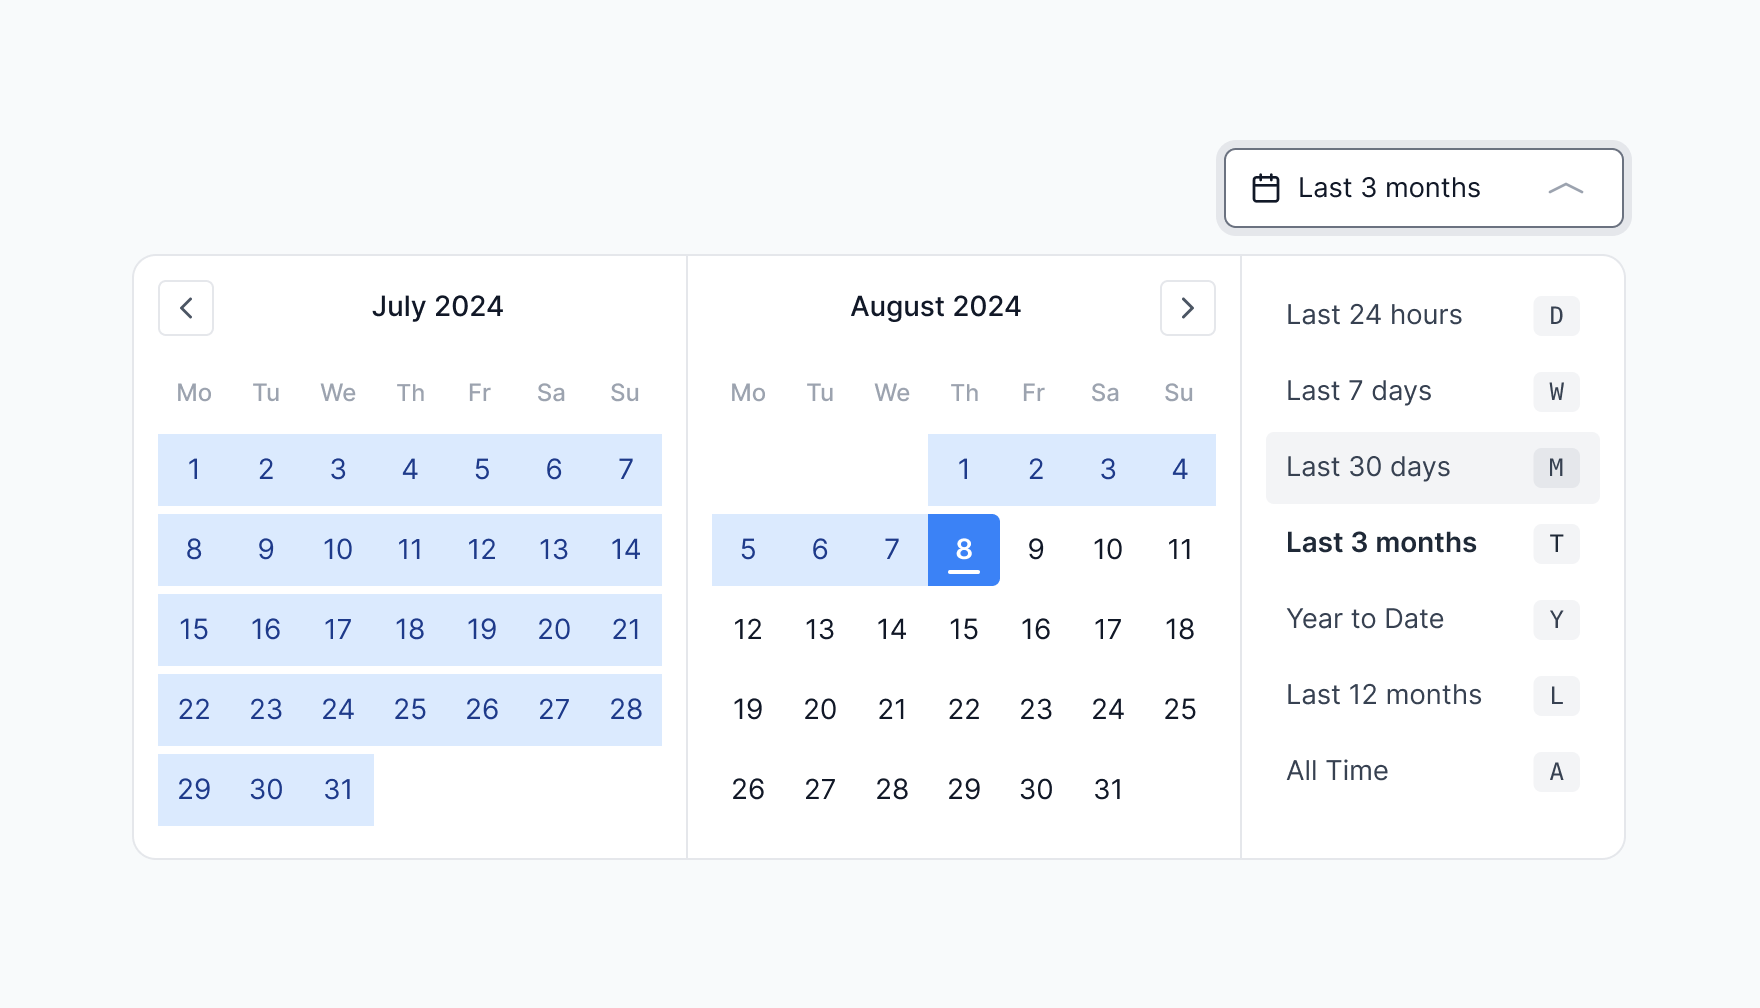
- Date Range Picker – Select custom date ranges for your reports
- QR scans vs link clicks – Track QR scans and link clicks separately
New Filter UX
The new filter dropdown is now keyboard-friendly and allows you to filter by multiple facets. This makes it easier to drill down into your data and create more granular reports.
Here are some of the new filter facets you can use:
- Domain – Filter by domain (e.g.
dub.sh,git.new,spti.fi) - Tags – Filter by tags (e.g. Social Media, Email Campaign, Blog Post)
- Device – Filter by device type (e.g. Mobile, Desktop, Tablet)
- Country – Filter by country (e.g. United States, India, Germany)
- Browser – Filter by browser (e.g. Chrome, Safari, Firefox)
- OS – Filter by operating system (e.g. iOS, Android, Windows)
- Referrer – Filter by referrer (e.g. Direct, Google, Facebook)
"Ask AI" feature
With this new update, we also introduced a new "Ask AI" feature, which lets you query your analytics with natural language.
For example, you can ask questions like:
- "mobile chrome users US only"
- "QR scans last quarter"
- "UK android users"
And Dub AI will automatically select the right filters and generate a report for you.
Date Range Picker
We've also added a new date range picker that allows you to select custom date ranges for your reports. This is especially useful when you want to compare data over different time periods, or when you want to focus on a specific time frame that is not covered by the preset date ranges.
Here's a live demo for you to try it out.
We've also added custom date range support in our Analytics API via the start and end query parameters. Here's an example:
QR scans vs link clicks
The final feature we've added is the ability to differentiate between QR scans and link clicks in your analytics. This is useful if you're running a campaign that uses both QR codes and links, and you want to see how each is performing.
To filter by QR scans or link clicks, simply select the Trigger filter type and choose between QR Scan or Link Click.
Get started with Dub Analytics 2.0
We're excited to bring these new features to Dub Analytics and hope they help you create more insightful reports and make better decisions for your marketing campaigns.
If you have any feedback or suggestions for our new Analytics experience, we'd love to hear from you – feel free to send us an email or tweet at us!


